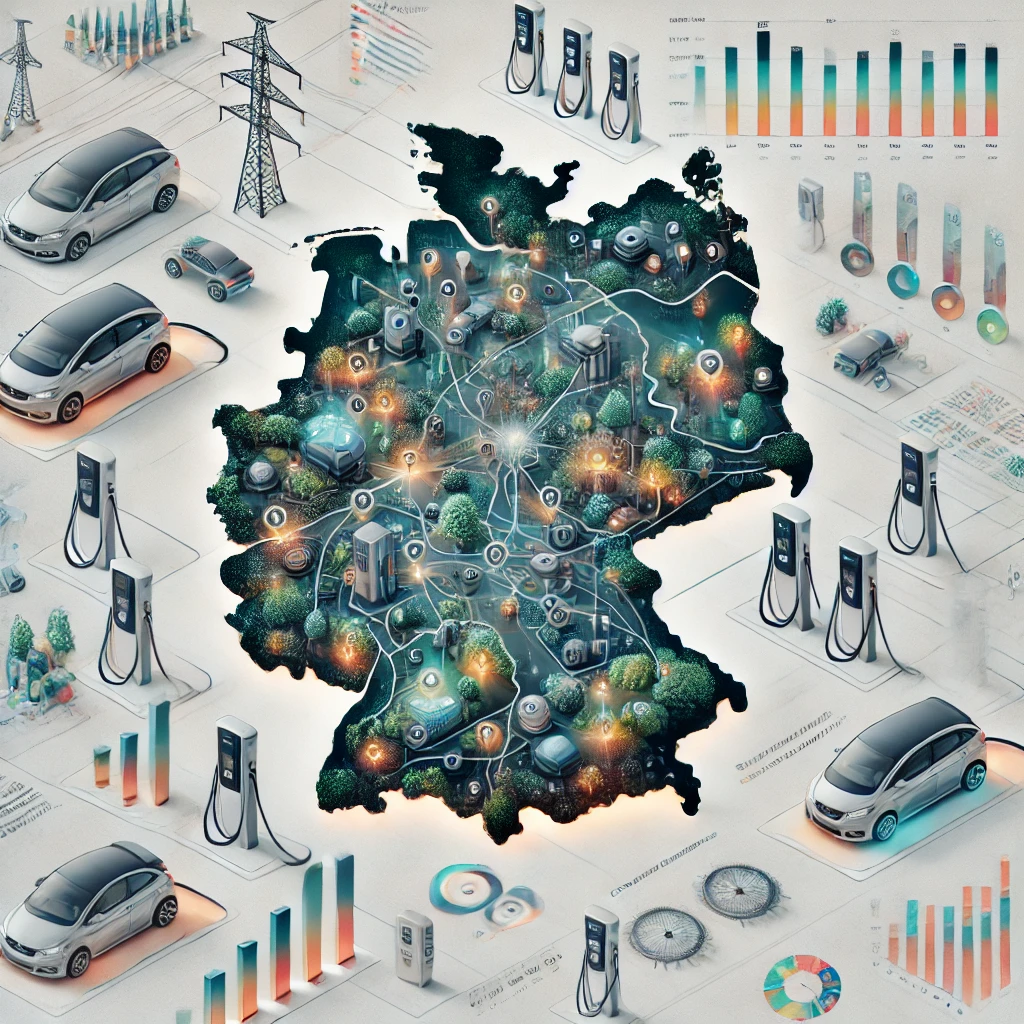
An analysis of the availability and usage patterns of electric-vehicle charging infrastructure across Germany, built as a data engineering course project at FAU. It combines Python for data manipulation, SQL for storage and querying, and machine learning for predictive analysis.
How it's built
- Python handles loading, cleaning and preprocessing, keeping every stage of the analysis connected.
- An ELT pipeline (Extract, Load, Transform) moves large datasets into the database before transforming them in place.
- SQLite, driven through SQLAlchemy, stores and serves the datasets.
- Machine learning surfaces predictive patterns and recommends where new infrastructure would pay off most.
- Plotly and Seaborn produce interactive charts of regional disparities, usage patterns and power capacity by station type.
- Matplotlib backs the exploratory work — distributions, correlation matrices and heatmaps.
What I set out to answer
- Distribution and usage. How are charging stations spread across Germany, and how does usage vary by location and station type?
- Capacity variation. How do power capacity and the number of charging points differ between station types?
- Regional disparities. Which regions are best and worst served — and what does that imply for expansion?
- Pipeline design. Demonstrate an ELT pipeline that ingests from several sources, cleans, transforms and delivers analysis-ready data.
- Recommendations. Turn the statistical findings into concrete proposals for extending the network into underserved areas.
Takeaway
Germany's charging network needs to be both well distributed and efficient to keep pace with EV adoption — and it needs continuous monitoring, because the landscape shifts faster than any one snapshot of the data can capture.